
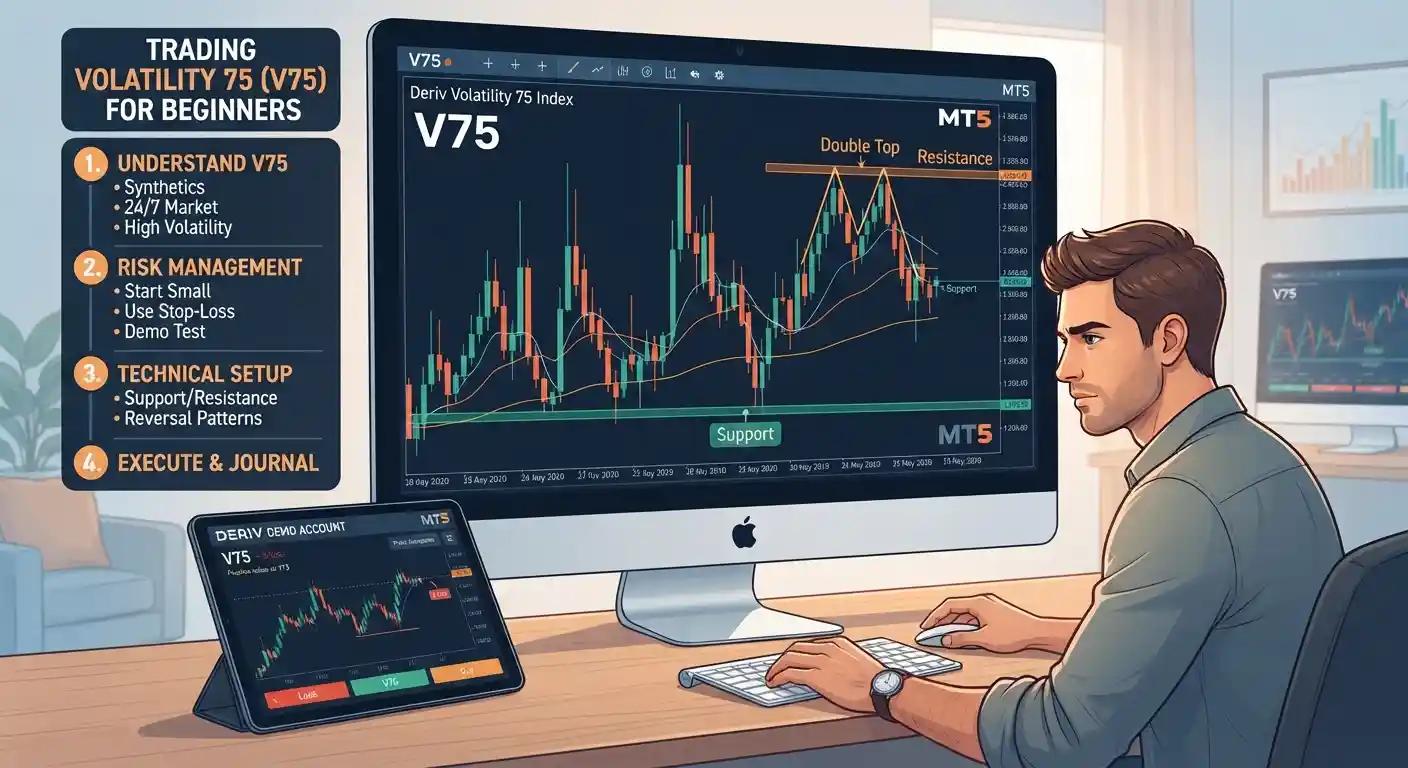
If you are searching for how to trade Volatility 75, you may have already come across V75 trading strategies, price action setups, support and resistance, and risk management. Volatility 75 (V75) is one of Deriv’s Synthetic Indices and is designed to simulate continuous price movement at a predefined volatility level. Unlike traditional financial markets, Deriv’s Synthetic Indices operate independently of economic news and conventional market hours.
For beginners, however, learning how to trade V75 is not simply about finding a buy or sell signal. Because V75 can produce significant price movements, traders need to understand market structure, position sizing, stop-loss placement, and trading discipline before risking real money.
This guide explains the basics of Volatility 75 trading for beginners, including how V75 works, how to read its chart, a simple structure-and-pullback approach, and the most important risk-management principles.
Quick answer: To trade Volatility 75 as a beginner, first understand how the Synthetic Index works, practise on a demo account, identify the higher-timeframe trend, mark support and resistance, wait for a pullback and price-action confirmation, and use a predefined stop-loss and position size that fits your risk tolerance.
What Is Volatility 75 (V75)?
Volatility 75, commonly called V75, is a Synthetic Index available through Deriv. It is designed to provide continuous price movement at a predefined volatility level rather than tracking an underlying stock, currency, commodity, or real-world index.
Deriv describes its Volatility Indices as proprietary derived instruments with fixed volatility levels that can be traded 24/7 and are not affected by conventional economic news or market closures.

This makes V75 different from markets such as EUR/USD, gold, or the S&P 500. Instead of analysing interest-rate decisions, company earnings, employment reports, or geopolitical events, traders focusing on V75 generally concentrate on the price chart and technical analysis.
The source material used for this guide similarly describes V75 as a Synthetic Index and emphasizes the importance of understanding price action and market structure when trading it.
Is Volatility 75 Good for Beginners?
V75 can be studied by beginners, but that does not mean it is a low-risk market.
The higher the volatility level, the larger and faster price movements can become. Deriv’s educational material explains that higher-volatility indices require greater attention to position sizing, stop-loss placement, and risk control.
For someone learning how to trade V75 for beginners, the goal should therefore be to learn the process rather than trying to make quick profits.
A sensible learning progression is:
- Learn how Synthetic Indices work.
- Open or use a demo account for practice.
- Learn basic candlestick and price-action concepts.
- Understand market structure.
- Practise identifying trends.
- Mark support and resistance zones.
- Learn how pullbacks work.
- Use stop-losses consistently.
- Keep position size appropriate to your account.
- Record and review your trades.
How Does Volatility 75 Trading Work?
V75 trading is based on analysing the price movement of the index and taking a position based on a predefined trading plan.
A trader may look for:
- An established uptrend or downtrend
- Higher highs and higher lows
- Lower highs and lower lows
- Support and resistance zones
- Trendline reactions
- Pullbacks
- Breakouts and retests
- Candlestick confirmation
- Risk-to-reward opportunities
The source material recommends analysing broader timeframes to identify the overall trend before moving to lower timeframes for potential entries.
The key idea is simple: do not enter a V75 trade simply because the price is moving quickly. Wait for a setup that matches your trading plan.
What Timeframe Should You Use for V75?
There is no single timeframe that is suitable for every trader.
A common approach described in the supplied source is to use D1 and H4 for understanding the broader market direction and then move to M15 or M5 for more precise entries.
Another structure-and-pullback setup in the source focuses on M15, M30, and H1 charts.
For a beginner, the important lesson is not to constantly switch between timeframes. Instead:
Higher timeframe → identify direction → mark important levels → lower timeframe → wait for confirmation.
This approach can help prevent random entries based on short-term candle movements.
How to Read the Volatility 75 Chart
Learning to read the chart is one of the most important parts of learning how to trade Volatility 75.
1. Identify the Market Trend
Start by asking:
- Is price making higher highs and higher lows?
- Is price making lower highs and lower lows?
- Is the market moving sideways?
- Where are the most recent swing points?
An uptrend generally consists of higher highs and higher lows, while a downtrend is characterised by lower highs and lower lows.
The supplied V75 strategy recommends identifying the broader trend before looking for an entry.
2. Mark Support and Resistance
Support and resistance are important areas where price has previously reacted.
In an uptrend, traders may pay attention to previous swing lows as potential support zones.
In a downtrend, previous swing highs can become potential resistance zones.
The source describes these areas as Points of Interest (POIs) for a structure-and-pullback setup.
3. Wait for a Pullback
Instead of chasing a strong price movement, wait for price to retrace toward an important area.
For example, price may:
- Establish an uptrend.
- Move strongly upward.
- Pull back toward a previous support area.
- Form a bullish price-action signal.
- Continue in the original direction.
The same principle can be applied to a downtrend.
The supplied strategy specifically recommends waiting for price to pull back toward the EMA 20/50 area or a nearby structure level before looking for entry confirmation.
A Simple Volatility 75 Strategy for Beginners: Structure + Pullback
One of the main strategies described in the source is the Structure + Pullback Strategy.
It combines:
- Market structure
- Trend direction
- Support and resistance
- Pullbacks
- Candlestick confirmation
- Stop-loss placement
- Risk-to-reward planning
The original setup lists trendlines, support/resistance zones and EMA 20/EMA 50 as its tools and recommends limiting risk per trade.
Here is how the strategy works.
Step 1: Identify the Trend
First determine whether V75 is generally moving upward or downward.
The source uses EMA 20 and EMA 50 as additional trend confirmation:
- EMA 20 above EMA 50 → potential uptrend
- EMA 20 below EMA 50 → potential downtrend
The strategy then recommends trading in the direction of the established trend.
Remember that an indicator should support your analysis rather than replace it. Market structure and actual price behaviour should remain part of the decision-making process.
Step 2: Mark the Structure Zone
Once you identify the trend, mark the important swing points.
For an uptrend, look at previous swing lows and support areas.
For a downtrend, look at previous swing highs and resistance areas.
These zones become potential areas where you can wait for the market to react rather than entering randomly.
Step 3: Wait for the Pullback
This is where patience becomes important.
If V75 is trending upward, you do not necessarily need to buy immediately after a large bullish candle. Instead, wait for a pullback toward an area that makes sense within your trading plan.
For a downtrend, look for a pullback toward resistance.
The objective is to find a potential entry after the market retraces instead of chasing the move.
Step 4: Look for Price-Action Confirmation
The supplied strategy identifies several candle patterns that can be used as entry confirmation:
- Bullish engulfing for potential buys
- Bearish engulfing for potential sells
- Pin bars or rejection wicks
For example, suppose V75 is in an uptrend and pulls back toward a previously identified support zone. A bullish rejection or bullish engulfing candle may provide additional confirmation for a potential long setup.
This does not guarantee that the trade will succeed. It simply gives the trader a defined condition for entering instead of making an emotional decision.
Step 5: Define Stop-Loss and Take-Profit
Risk management should be decided before entering the trade.
The supplied strategy gives an example of placing the stop-loss around the relevant swing and targeting a 1:2 risk-to-reward structure.
However, fixed point distances should not automatically be copied onto every V75 trade. Stop placement should account for the current chart structure, volatility, instrument specifications and your position size.
Deriv’s own educational material also emphasises using stop-losses, appropriate position sizing and avoiding overtrading when managing Synthetic Indices.
How Much Money Do You Need to Trade Volatility 75?
There is no single account size that guarantees a trader can safely trade V75.
The appropriate position size depends on factors such as:
- Account equity
- Entry price
- Stop-loss distance
- Contract specifications
- Risk percentage
- Trading product being used
- Individual risk tolerance
The source recommends conservative lot sizes and warns against using unnecessarily large positions, especially with smaller accounts.
Rather than asking, “What is the best V75 lot size?”, a better question is:
“What position size keeps my planned loss within the amount I am prepared to risk?”
This is a much more useful long-term approach to V75 risk management.
Risk Management When Trading V75
Risk management is arguably more important than finding a perfect V75 strategy.
Even a well-planned setup can lose.
Use a Stop-Loss
The supplied source strongly advises against trading without a stop-loss and explains that stop placement can be based on relevant swing highs and lows.
A stop-loss defines where your trade idea is considered invalid.
Avoid Randomly Stacking Trades
Opening multiple positions without a clear reason can increase exposure quickly.
The source specifically warns against random trade stacking and recommends maintaining healthy margin and only adding positions when the trader’s plan and equity support it.
For beginners, one clearly planned position is often easier to manage than several impulsive positions.
Do Not Increase Your Position After a Loss
A losing trade should not automatically be followed by a larger trade to recover the loss.
This can turn a normal losing trade into a much larger account drawdown.
Set Daily Trading Limits
The supplied source recommends having predefined daily profit and loss targets rather than attempting to make a large amount of money in a single session.
The exact dollar target should be personal to the trader and account size. What matters is having a predefined limit and following it consistently.
Start With a Demo Account
A demo account allows beginners to practise chart analysis and execution without immediately putting real money at risk.
Deriv’s beginner education also includes demo-account setup as part of learning Volatility Indices.
Can You Trade Volatility 75 24/7?
Yes. Deriv states that its Volatility Indices are available around the clock and are not tied to traditional market opening and closing hours.
This is one of the main differences between Synthetic Indices and traditional markets.
However, 24/7 availability does not mean you need to trade continuously.
A beginner can benefit from defining specific trading sessions and avoiding excessive screen time or impulsive entries.
Does News Affect Volatility 75?
Volatility 75 is different from traditional markets because Deriv’s Synthetic Indices are designed independently of real-world economic events and market news.
For example, traders do not need to analyse a traditional economic calendar in the same way they would when trading a major forex pair.
This allows traders to focus more heavily on:
- Price action
- Market structure
- Support and resistance
- Trend direction
- Trade management
That does not eliminate risk. V75 can still move quickly, and traders can lose money.
Common Mistakes Beginners Make When Trading V75
1. Trading Without a Plan
Entering because a candle “looks good” is not a complete trading strategy.
Define your setup before entering.
2. Using Too Many Indicators
The source recommends making price action a major part of V75 analysis and warns that adding too many indicators can make charts unnecessarily complicated.
A clean chart can make market structure easier to understand.
3. Chasing Large Candles
A strong candle does not automatically mean that price will continue moving in the same direction.
Wait for your setup.
4. Ignoring the Higher-Timeframe Trend
A lower-timeframe signal can be misleading when it goes against the broader structure.
Check the higher timeframe before entering.
5. Trading With Excessive Position Size
A good analysis can still lose.
If the position is too large, one losing trade can create unnecessary damage to your account.
6. Trying to Recover Losses Immediately
Losses are part of trading. Increasing risk simply because the previous trade lost can create a dangerous cycle.
7. Trading Emotionally
Fear, greed, frustration and revenge trading can all cause traders to abandon their plan.
The solution is not another indicator. It is a predefined process.
V75 Price Action: What Should Beginners Look For?
If you want to learn V75 price action trading, start with basic chart structures instead of complicated strategies.
Focus on:
- Higher highs
- Higher lows
- Lower highs
- Lower lows
- Breaks of structure
- Support
- Resistance
- Rejection candles
- Engulfing candles
- Pullbacks
- Trendlines
The supplied source also highlights M and W formations as patterns traders may encounter on V75 charts.
The objective is not to memorise dozens of patterns. It is to understand what price is doing and whether the setup fits your trading plan.
Volatility 75 vs Forex: What Is the Difference?
The biggest conceptual difference is that V75 is a Synthetic Index rather than a traditional currency pair.
Forex prices are influenced by economic data, central-bank decisions, interest rates, geopolitical events and other real-world factors.
Deriv’s Synthetic Indices are algorithm-generated markets designed to simulate market behaviour without being directly affected by those real-world events.
For this reason, someone trading V75 can focus primarily on technical analysis and risk management rather than traditional fundamental analysis.
What Is the Best Strategy for Volatility 75?
There is no universally “best” V75 strategy.
Different traders use different approaches, including:
- Price action
- Structure and pullbacks
- Trend following
- Support and resistance
- Moving-average confirmation
- Scalping
- Breakout strategies
For beginners, a structure + pullback approach can provide a clear framework because it defines the trend, identifies an area of interest, waits for a retracement, and then requires confirmation before entry.
The strategy described in the supplied source follows exactly this general sequence.
The important part is to test any strategy on historical charts and a demo account before considering real-money trading.
Frequently Asked Questions About Volatility 75
What is Volatility 75?
Volatility 75, or V75, is a Synthetic Index offered by Deriv that simulates continuous price movement at a predefined volatility level. It operates independently of traditional market news and market hours.
How do I trade Volatility 75 as a beginner?
Start by learning how the index works, practise on a demo account, identify the broader trend, mark support and resistance, wait for a pullback, look for price-action confirmation, and use appropriate position sizing and a stop-loss.
Is V75 suitable for beginners?
Beginners can learn to analyse V75, but it should not be treated as a low-risk market. Higher volatility can produce larger price movements, making risk management particularly important.
What is the best timeframe for V75?
There is no universal best timeframe. The supplied strategy uses higher timeframes such as D1 and H4 for broader direction and lower timeframes such as M15 and M5 for entries, while its structure-and-pullback setup focuses on M15, M30 and H1.
Does news affect V75?
Deriv states that its Synthetic Indices are not affected by real-world news, economic events or traditional market hours.
Can I trade V75 24/7?
Yes. Deriv’s Volatility Indices are available 24/7, including outside traditional market hours.
What indicators are useful for V75?
The supplied strategy uses EMA 20 and EMA 50 alongside trendlines and support/resistance. However, indicators should be used as confirmation rather than as a substitute for understanding price action and market structure.
How much should I risk on a V75 trade?
There is no universal dollar amount. Your risk should be determined by your account size, position size, stop-loss distance, product specifications and personal risk tolerance. The supplied strategy recommends limiting risk per trade, while Deriv’s educational resources also emphasise position sizing and risk management.
Can I make money trading Volatility 75?
Trading V75 can result in either gains or losses. There is no guaranteed strategy or guaranteed return. The supplied source explicitly warns that traders will not win every trade and that poor risk management can cause substantial account losses.
Final Thoughts: Learning How to Trade V75
Learning how to trade Deriv Volatility 75 as a beginner is less about finding a secret indicator and more about developing a repeatable process.
Start with the basics:
Understand V75 → identify the trend → mark structure → wait for a pullback → confirm with price action → define your stop-loss → control position size → manage the trade.
The structure-and-pullback approach is one framework you can study, but it should be tested and adapted to your own trading plan rather than treated as a guaranteed formula.
Most importantly, do not confuse high volatility with easy profits. V75 can provide frequent price movement, but that same volatility can increase losses when position sizing and risk management are poor.
If you are completely new to Synthetic Indices, practise first, keep your risk controlled, and only trade money you can afford to lose.
Risk disclaimer: Trading derivatives and other leveraged financial products involves significant risk. You may lose some or all of the money you commit to a trade. This article is for educational and informational purposes only and is not financial or investment advice.